
Why Your Revenue Is Growing But Your Profit Isn't
Trent West ·
Time to read: 5 minutes.
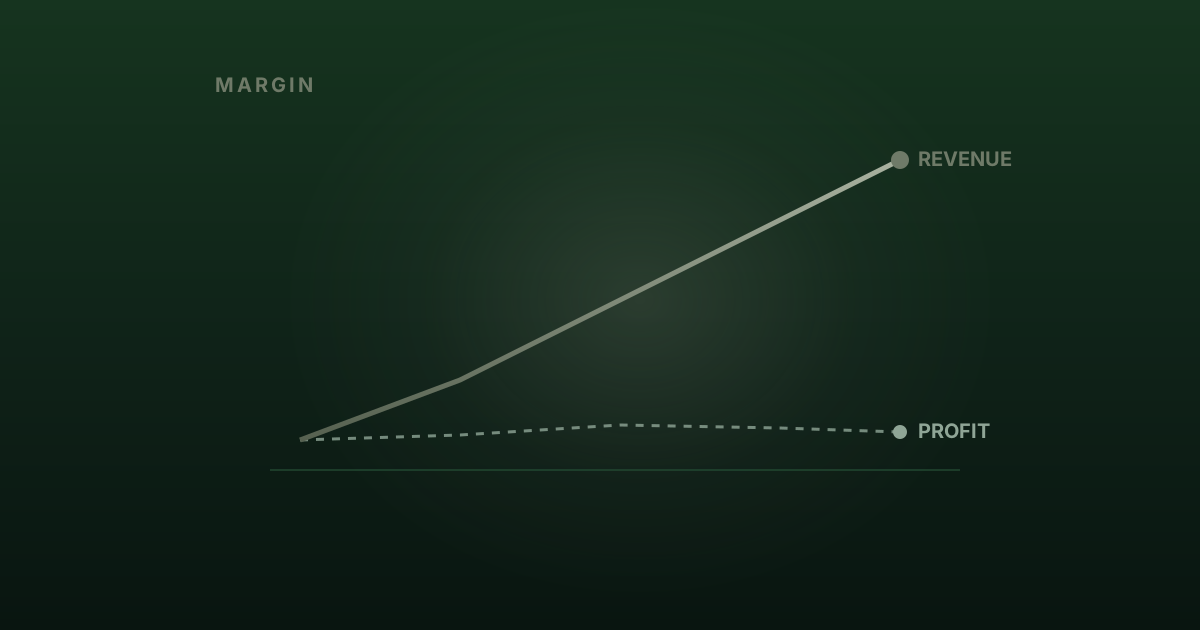
Revenue is up. The team is busy. The business looks, from the outside, like it’s doing well.
But the profit isn’t there. Or it’s there, barely, and nobody can say with confidence what drove it, or whether it will hold.
This is one of the most common situations we encounter with owner-led businesses. And it is almost always misdiagnosed.
The instinct is to look at the wrong thing
When revenue grows but profit doesn’t follow, the first place most owners look is cost. Something must have blown out. So the search begins: travel, headcount, suppliers, discretionary spending.
Sometimes a cost line has drifted. But more often, the costs are roughly where they should be, and the problem is somewhere else entirely.
The second instinct is to push revenue harder. If margin is thin, sell more of it. But scaling thin-margin activity doesn’t improve profitability. It compounds the problem and consumes the cash flow you need to fix it.
Neither response addresses the actual cause.
Why the P&L doesn’t show you where the problem is
The aggregate profit and loss statement is a summary. It tells you what happened. It doesn’t tell you which part of the business made money, which part didn’t, or what the relationship is between the two.
A business turning over $8 million might have three revenue streams, one genuinely profitable, one breaking even, and one quietly destroying value every month. In the aggregate accounts, all three blend together. The profitable stream subsidises the loss, and the summary looks acceptable.
This is the constraint that most aggregate reporting creates: it shows the result, not the cause.
The same dynamic applies to customer segments. In many owner-led businesses, a small number of customers generate the majority of the margin. A larger number consume significant resource, in service delivery, in management time, in credit exposure, at margins that don’t justify it. The revenue from both groups appears in the same line. The difference in margin does not.
The three structural causes most commonly missed
Once you disaggregate the P&L, by product, by customer, by channel, the same patterns appear with regularity.
Margin leakage at the product or service level. Pricing decisions made years ago, applied to a cost structure that has since changed. Labour costs, input costs, and overheads have moved. The price hasn’t. The gap between what the product costs to deliver and what it earns has quietly narrowed, or reversed, without anyone noticing because the top line kept growing.
Customer concentration masking poor segment economics. Growth has come from a specific customer type or channel that looks attractive on volume but requires disproportionate resource to service. The business has scaled into a customer segment that doesn’t actually generate the margin the revenue numbers imply.
Cost structure that has grown with revenue but not with discipline. In growth phases, businesses add capacity, people, systems, space, in response to demand. That’s rational. But the structure of those costs often doesn’t get revisited once the growth flattens. Overhead that was justified at $10 million in revenue becomes a drag at $8 million, but it stays in place because nobody has mapped it back to the activities it supports.
None of these are effort problems. The team is working. The owner is across the business. But the things creating the margin problem are not visible at the level of aggregation most reporting operates at.
Why the usual responses don’t fix it
The businesses that struggle most with this problem are not the ones making bad decisions. They’re the ones making reasonable decisions based on incomplete information.
Cutting costs without knowing which costs are actually attached to margin-generating activity risks removing capacity you need. Pushing revenue without knowing which revenue is worth having makes the problem harder to see and harder to fix. Restructuring without a precise diagnosis produces change that satisfies the need to act but doesn’t address the underlying constraint.
The difficulty is that finding the cause requires a different read of the business than most owners have access to. It requires disaggregating financial performance in a way that most standard reporting doesn’t support, and doing it independently, without the prior assumptions that come from being inside the operation day to day.
An accountant working from the same data the business already has will find the same picture the business already sees. A coach will surface what the owner already suspects. Neither is a substitute for a rigorous, outside read of what the numbers are actually showing.
What actually moves the needle
The businesses that fix this problem share a common starting point: they get a precise picture of where margin is being created and where it is leaking, at a level of specificity that makes it actionable.
That means understanding which products or services are genuinely contributing to profitability, which customer segments generate margin worth having, and which cost lines are attached to value-generating activity versus overhead that has accumulated without scrutiny.
Once the picture is clear, the response tends to be more targeted than expected. Not a wholesale restructure. Not a cost-cutting program. A specific set of decisions, on pricing, on customer mix, on cost allocation, that addresses the actual constraint rather than the symptom.
The revenue growth is often fine. The business has demonstrated it can sell. The question is whether it can convert that revenue into profit with the same discipline it has applied to growth.
In most cases, the answer is yes. But only once the constraint is visible.
Sources
Australian Bureau of Statistics, Business Indicators; Reserve Bank of Australia, Financial Stability Review; ASIC Insolvency Statistics FY2023-24.
Every business has one constraint doing most of the damage.
Find out what's constraining yours →2 questions · 60 seconds · No login