
Goals, Objectives, Key Results, KPIs and Initiatives: How They Actually Connect
Trent West ·
Time to read: 9 minutes.
There’s a version of goal-setting that looks disciplined and delivers almost nothing. The business runs a quarterly ritual: objectives get written, key results get colour-coded, a dashboard of KPIs glows green, and a list of initiatives sits alongside. Everyone can name the framework. Twelve months later enterprise value hasn’t moved, and nobody can say which of those neat quarterly objectives was responsible. The framework wasn’t wrong. It was floating, disconnected from the owner’s actual goal at the top and never reconciled against the accounts at the bottom, so it measured activity in the middle and called it strategy.
The five terms people use here, goals, objectives, key results, KPIs and initiatives, are genuinely useful. The problem is almost never the terms. It’s that they get stacked as a vocabulary rather than connected as a chain, and a chain with a missing link carries no load. It’s worth being precise about what each one is, because the precision is the point, and then showing how the APG cascade links all five from the owner’s ambition down to the money.
The cascade, top to bottom
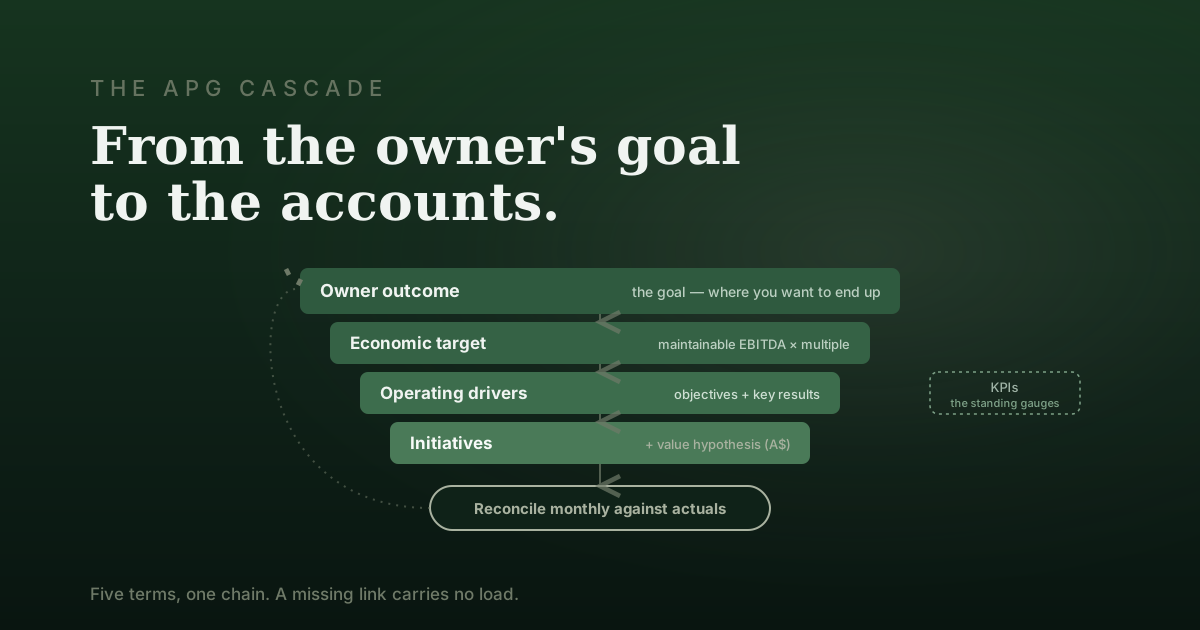
APG doesn’t start with a quarterly objective. It starts with the owner outcome: where you actually want to end up. Usually that’s an enterprise-value ambition with a time on it, some version of “worth enough to sell in three years and step back.” That ambition is the goal, and everything below it exists only to serve it. Most goal-setting frameworks skip this and start a rung too low, which is why their objectives can all go green while the thing the owner cares about doesn’t move.
From the owner outcome comes the economic target: the financial destination the ambition implies. If you want a certain enterprise value at a realistic multiple, that resolves into a required level of maintainable EBITDA, and a required quality of those earnings. This is the number, and it’s the translator between what the owner wants and what the business has to do.
Below the economic target sit the operating drivers. These are the specific, few changes in the business that move the number: pricing discipline, capacity utilisation, customer concentration, owner dependency. In OKR language these are your objectives, the qualitative statements of what you’re changing. The discipline APG adds is that a driver only earns its place if you can trace its line to the economic target. If improving it wouldn’t move maintainable EBITDA or the multiple, it isn’t a driver, it’s a preference.
Each driver then needs two different kinds of measure, and confusing them is the single most common mistake in this whole area. The first is the target level for the period, the measurable outcome that would prove the driver has moved. This is what OKRs call a key result. It’s bounded and time-boxed: “lift gross margin from 32% to 38% by year end,” or “reduce top-five customer concentration from 45% to below 30%.” A key result is a finish line, not a dial.
The second measure is the KPI, and a KPI is a permanent gauge, not a finish line. Gross margin percentage is a KPI. You watch it every month, forever, whether or not you have an objective about it this quarter. The relationship between the two is simple once you see it: a key result is usually a commitment to move a KPI from one level to another by a date. The KPI is the instrument; the key result is the destination you’ve set on it for now. A business drowning in KPIs but with no key results is monitoring itself without steering. A business with key results but no underlying KPIs has set destinations it has no instrument to read.
At the bottom sit the initiatives. An initiative is the intervention, the actual work you do to move the key result: the pricing review, the new quoting tool, the account-diversification programme. Initiatives are inputs. Key results are outputs. This is the other confusion worth killing, because a plan that’s all initiatives and no key results is a to-do list wearing a strategy’s clothes, and a set of key results with no initiatives underneath is a wish. The initiative is the cause; the key result is the effect you’re betting it will produce.
The two links everyone leaves out
Everything so far is a reasonably standard cascade, and plenty of frameworks get this far. What they usually miss are the two links that make it actually create value rather than merely organise effort.
The first is a value hypothesis on every initiative. In the APG model an initiative doesn’t just claim it will help a key result, it carries a number: the gross opportunity, the share you expect to capture, the cost to achieve it and your confidence, which resolve to a committed value in dollars. That number is what lets you rank initiatives against each other on the same footing, and it’s what connects the bottom of the cascade back to the economic target at the top. Without it, the link between “we did the work” and “the number moved” is an article of faith.
The second is reconciliation. Once an initiative has a value hypothesis and a key result has a target, you can do the thing almost nobody does: each month, hold the actuals against what you predicted. Did the key result move as far as the initiative promised? Did the KPI follow? This is the Monthly Value Review, and it’s what turns the cascade from a static plan into a loop that learns. The estimates meet reality, the wrong ones get corrected, and next quarter’s objectives are set on better information than this quarter’s were.
Why the connection is the whole game
The honest concession is that the ritual has real value even when it’s disconnected. Writing objectives forces conversations that wouldn’t otherwise happen, and a team that agrees on five key results is more aligned than one that agrees on nothing. That’s worth something. It just isn’t worth what the owner needs, which is enterprise value that actually moves.
The difference between a scoreboard and a system is the connection. When the chain holds, from owner outcome to economic target to operating driver to key result, with a KPI to read it, an initiative with a value hypothesis to move it, and a monthly reconciliation to check it, then every green key result traces to a dollar figure, and every dollar figure traces to what the owner set out to build. That is the cascade the APG Platform runs, and a Commercial Assessment is where it gets built from your actual numbers. If you want to see how tightly your own goals, drivers, measures and initiatives connect, the Goal Cascade Builder maps the chain and shows you exactly where a link is missing.
Every business has one constraint doing most of the damage.
Find out what's constraining yours →2 questions · 60 seconds · No login